Excel template for cohort analysis and customer life time value


Whether you are a founder or an analyst assessing an attractiveness of a SaaS product or recurring b2c marketplace, one thing that must be at your fingertips is the understanding of a Customer Life Time Value (LTV).
Despite the absolute value of LTV does not tell you much, when compared to Customer Acquisition Cost (CAC) it becomes one of the most valuable metrics a start-up must track to understand the effective of marketing and such marketing channel scaling potential.
Cohort analysis is an essential tool that lets you analyze usage of your product in time and gives a clear trend of what is happening to client churn and is the essential component for calculating LTV.
Despite much already written on current topics, many founders of early stage companies for unclear reasons still neglect doing it early.
Current post it focused on sharing a step-by-step guide of how to perform cohort analysis as well as provides you with a fully automated template excel based on transaction data which can you modify to your needs.
You can download the Excel file here
The guide below focuses on creating automated template to construct cohorts, get churn values and calculate LTV. Specifically, what you’ll have to type in (or import from a data source) is 3 columns of transaction data.
Here is the summary we will cover below:
- Preparing the data feeds
- Performing cohort analysis
- Calculating churn and LTV
Let us dive deep.
Step 1: Preparing the data feeds
To perform cohort analysis, it requires you have the following feed of transactional data:
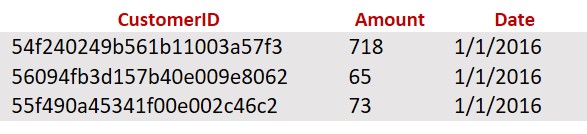
- CustomerID – Unique user, who is paying for the service
- Amount* – Size of each transaction / monthly subscription
- Date – date of the transaction
*If you have annual and monthly subscription plans, you will have to create 12 transactions one for each month, updated template to incorporate annual subscriptions will follow soon
Here is an example:
CSV dump from internal billing systems or CRM with 3 columns of data rarely takes more than couple minutes to perform, it’s that simple.
Step 2: Performing cohort analysis
What is a cohort analysis?
Subset of behavioral analytics that takes the data from a given dataset (e.g. an eCommerce platform, web application, or online game) and rather than looking at all users as one unit, it breaks them into related groups for analysis.
source: wiki
Why is it so important?
By definition, each cohort is bound to a specific time and tracks performance of such data series in time. This creates comparability between different time series and increases accuracy and transparency of forecasts.
How to construct a cohort table?
For the purposes of this guide, we will consider whether a client has churned or not. In our example, we will have multiple tiers (where tiering of clients is based on how much revenue client generates per month). Reporting period is typically month or week. For mobile apps its usually weeks, for SaaS and marketplaces generally it's a month.
In each row, we will store figures only associated with clients that started paying for product/service in that particular reporting period. In many occasions (for example in apps) the reporting period will represent not the start date of first payment, but date of install. Which one to chosen all depends on what’s the goal of cohort analysis and monetization pattern of clients.
In each column, we will store figures associated with how many clients were still paying after N months associated with a particular reporting period.
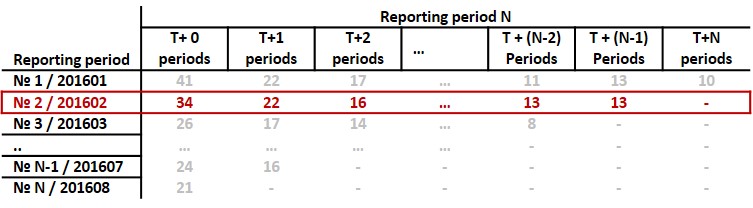
So, in row “Reporting period 2” we will count how many clients paid for product/service in Reporting Period 2 after M months.
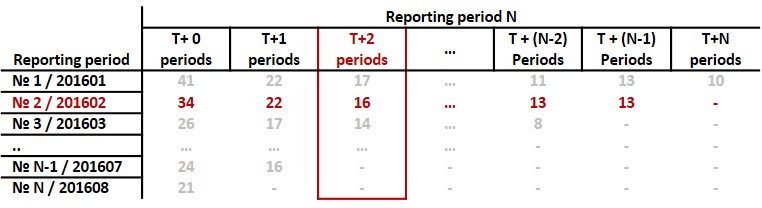
In column “T+2 periods” we will count how many clients still paid for product/service after 2 reporting periods.
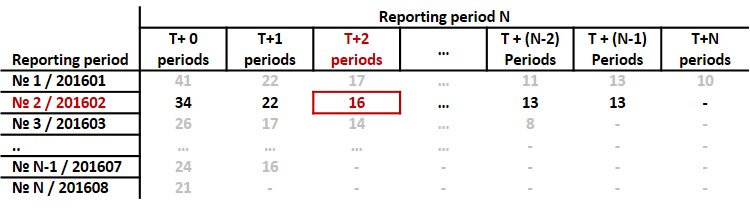
At the intersection of row 2 and column T + 2 we have exactly how clients which started paying in reporting period 2 that continued to pay after 2 months, which is 16.
From the table we see that bottom right part of the table consists of many 0s (-), this is because all those cells represent future dates. For example, for most recent reporting period N, even T+1 period is next period, which still hasn’t happened. The only reason why some cell may not be zero if you have signed an just signed an annual contract and have included in cohort analysis future payments until a maturity date of a contract.
Step 3. Calculating churn and LTV
To calculate retention in time we have to normalize the data, so let’s divide each cohort by its T+0 metric.
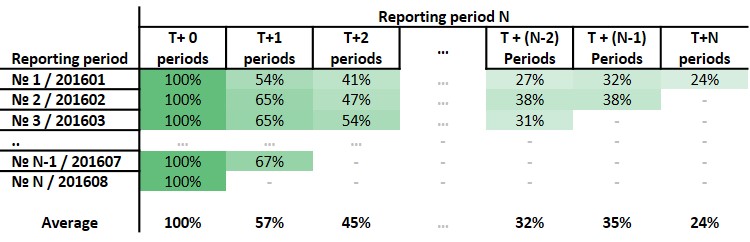
Improvement in percentages in the column means there is a positive development in younger cohorts versus older cohorts. In above example, there’s slight improvement in retention in 2nd and 3rd month.
Generally, the client cohorts should not grow in time, however, if you have multiple tiers of clients as in examples (with qualification based on an amount of revenue client generates a month) sometime client can move from tier to tier and create some fluctuations. For instance, growth in reporting period №1 at T + N-2 column from 27% to 32% in T + N-1 column means some clients moved from a different tier to current one. The slower the cohort decreases in time the better the stickiness of the product.
To calculate monthly churn, instead normalizing date by initial period, we normalize date relative to previous month (T+1 / T+0 or T+2/ T+1, etc)
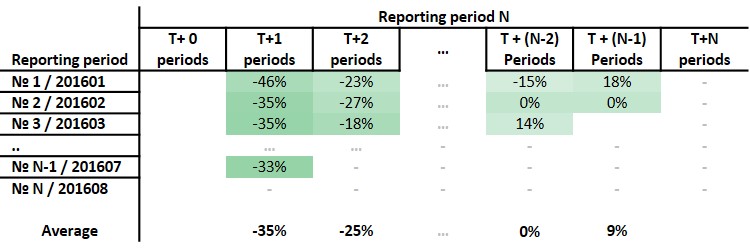
In the example above, we see that after several months of significant monthly churn, the churn stops and some client even come back.
What is customer Life time value?
A prediction of the net profit attributed to the entire future relationship with a customer.
source: wiki
In Excel sheet "LTV", there are couple approaches to estimation of customer LTV.
- Take in initial period data and forecast based on an exponential decay function. Columns D-G in Excel.
This work pretty well if you have at least 7-10 data points. A tip is only to start extrapolating exponential decay after an initial drop in clients, otherwise, the decay function is over slapping the churn after 6 months and tail of exponent.
- Use average retention levels of clients (which we calculated previously) and extrapolate data based on average statistics how many clients will be at each reporting period. Column C in Excel.
This approach is favorable when only a few month of data is present is it will give you an indication how much revenue clients from that cohort will bring you. The problem you may run into if your cohort significantly improves or worsens, then your forecast can be off.
Let's finish the topic with some math:
Below is a formula for calculating LTV:

However, if it is often helpful to estimate customer lifetime value of customer segments or tiers where parameters of gross contribution and retention are relatively fixed across periods. In such a case LTV can be expressed as a simpler model assuming an infinite economic life (N-> infinity). The above formula translates into a sum of geometric progression which can be simplified into the following equation:

For example: $100 avg monthly spend * 75% margin ÷ 5% monthly churn = $1,500 LTV
Some links to other useful posts on the topic:
- Excel template for cohort analyses in SaaS by Christoph Janz
- Stop! You're Doing Lifetime Value Wrong! by Mahesh Vellanki
Further notes are included in the Excel sheets here.
If you have any questions or comments, please feel free to reach out!